It’s Tuesday evening. A Texas Senate campaign has a town hall in 30 hours, and the opening remarks need four numbers by Thursday morning: the uninsured rate, child poverty, fentanyl deaths, and housing affordability. All four exist in federal databases, published for free, updated regularly. The problem is they’re scattered across five agencies (Census, BLS, CDC, HUD, and Zillow), each with its own file format, its own naming conventions, and its own way of identifying geographic areas. Even in a statewide race, county-level variation matters. The difference between Hidalgo County and Collin County is the difference between two different states, and a statewide average hides both of them.
Getting these numbers into the same spreadsheet usually takes longer than actually analyzing them.
OpenData puts all of it in one place. Income, healthcare access, overdose deaths, housing costs, all searchable and sortable the same way. The data cleanup that usually eats your morning is already done.
The public half of campaign data
Campaign data has two halves. The proprietary side (voter files, predictive models, contact history) is what the vendors sell you. The public side is free, updated regularly, and covers every county in the country. But income, unemployment, housing costs, and overdose deaths each live on separate agency websites with different file formats and naming conventions. A simple question like “what does affordability look like in this district?” means pulling from four sources and stitching them together by hand.
The second-largest economy in the country, and most national models still treat it as safe red. But a 31.5% income shift since 2018 changes the composition of who lives in Texas and what they care about. Income growth alone doesn’t tell you what a district feels like, though. For that, you need to see what that income actually buys, who doesn’t have coverage, and where the fentanyl crisis is hitting hardest. And for that, you need data from agencies that don’t talk to each other.
Same data, before and after
That income chart took about 30 seconds to build. Here’s why it usually takes a lot longer, starting with the raw source for unemployment data from the Bureau of Labor Statistics.
The raw government file doesn’t say “Texas” or “unemployment rate” anywhere. Instead, it uses codes like LAUST480000000000003 that pack the state, geographic area, and measurement type into a single string. To turn that into something readable, you need three additional reference files: one to look up the state, one for the area name, and one for the measurement type. Four files just to get one usable number.
Same data, two experiences. The top block is the raw government file: cryptic codes, no state names, no labels for what’s being measured. The bottom is that same data on OpenData, with columns you can actually read, filterable by state name, and sorted by date.
Now the same treatment for Census county income and poverty estimates. The government version has columns with names like poverty_percent_age_5_17_in_families. On OpenData, both unemployment and income data work the same way: pick a state, pick a year, get results.
Two agencies, two completely different source formats, one consistent experience. The column names make sense, the state and county identifiers match across datasets, and neither file required a download or a manual lookup.
What the clean data shows
Once the formatting headaches are out of the way, questions that used to take a morning of file prep become a few minutes of actual analysis. Here are three stories from three different federal sources, all pulled from the same platform.
One in six Texans has no health insurance
Healthcare access is a stump-speech stat in every competitive race in the South and Southwest. The spread between states is enormous, and the data is published by the Census, ready to use on OpenData.
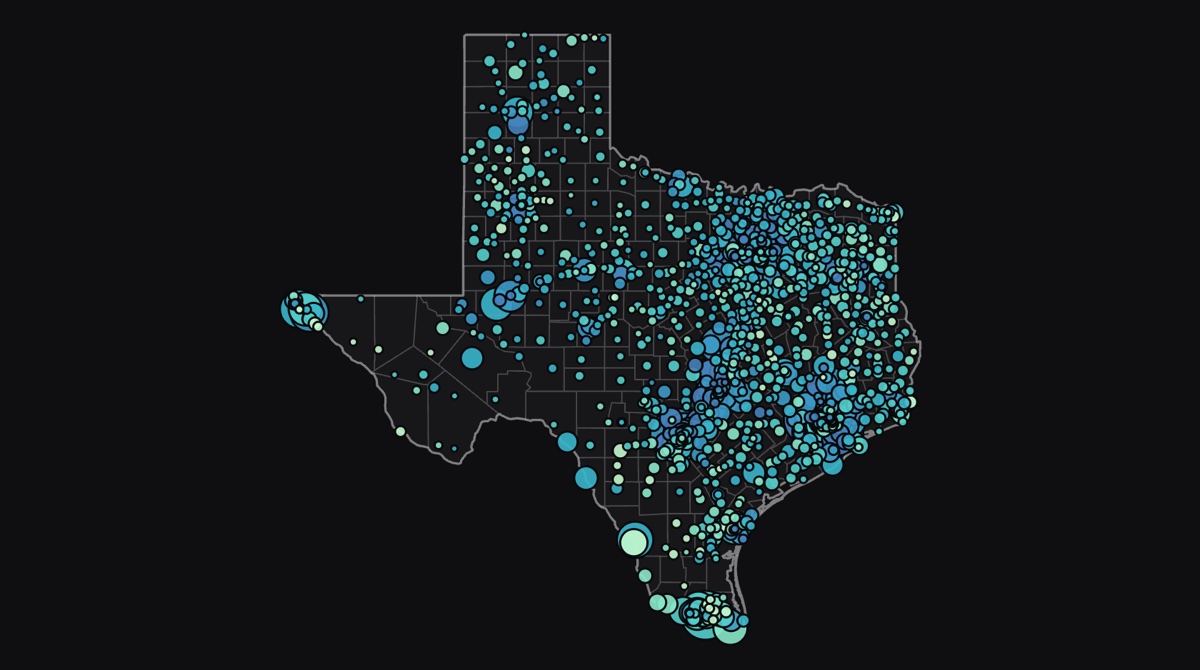
The statewide number tells one story. The county-level picture tells a sharper one. Presidio County is at 33.5% uninsured and Hidalgo County is at 30.2%, both along the border. Move north to Collin County and it drops to 10.6%. Travis County sits at 12.8%. The five lowest and five highest states on the chart above are effectively different countries when it comes to healthcare access, and Texas has that same variation within its own borders.
Fentanyl deaths peaked in 2023 but Texas is still 3.6x the pre-pandemic level
The fentanyl crisis exploded during the pandemic, peaked at 2,550 deaths in 2023, and has since declined significantly. But “declining” still means nearly 1,400 Texans per year, 3.6 times the 2019 baseline. A campaign can cite the progress while making the case that the crisis is far from over.
This data comes from the CDC’s drug overdose death reports, broken down by drug type and state. The full arc matters for campaign purposes: the 2019-to-2023 rise makes the case for urgency, while the post-2023 decline lets a candidate point to progress without overselling it. “We’ve cut fentanyl deaths by nearly half from the peak, and we’re still losing 1,400 Texans a year” is a credible talking point backed by federal data.
Child poverty ranges from 6% to 45% in the same state
Statewide averages mask the reality. In Brooks County, nearly half of all children live in poverty. In Denton County, it’s under 6%. A campaign running on child welfare in one county is running a completely different race than a campaign 500 miles away.
Three federal sources (Census income, CDC overdose deaths, Census health insurance), three completely different file formats, all accessible the same way on one platform. That’s three of the four numbers for Thursday, pulled in minutes instead of hours.
The comparison that eats the morning
The most useful campaign analysis often comes from combining data that different agencies publish separately. Say you want to answer a simple question for the town hall prep: which states have the worst housing affordability relative to what people actually earn?
Two sources have the pieces. Census publishes median household income by state. Zillow publishes what a typical house costs. Same states, but published by different organizations with different file formats and slightly different names for the same places. Normally, answering this means downloading both files, cleaning up the state names so they match, and manually combining the results. On OpenData, both datasets are already in the same system with matching state and county identifiers, so combining them takes seconds instead of a morning of spreadsheet work.
Texas at 3.79x looks moderate next to California (7.64x) or Hawaii (8.11x), but that statewide number flattens real variation. Travis County (Austin proper) is at 4.92x while Williamson County next door is 3.60x. Families moved to Williamson for affordability, and even that relief is getting squeezed. The point for campaign purposes: housing affordability plays differently in every county, and the data to make that case comes from combining Census income with Zillow home prices at the county level, two datasets that don’t naturally talk to each other.
The datasets
The datasets that matter for campaign work are spread across a handful of federal agencies. Here’s what’s available on OpenData today, organized by the kinds of questions campaigns actually ask.
Income and poverty: Census county income and poverty estimates (all 254 Texas counties, 2018-2024)
Healthcare access: Census health insurance coverage (state-level, 2008-2024) and County Health Rankings (all 254 TX counties: income, poverty, uninsured, mental health, and more)
Drug crisis: CDC overdose deaths (monthly, through October 2025, fentanyl breakout by state) and CMS drug pricing data
Housing and affordability: Zillow home values (state, metro, and county level, monthly since 2000), HUD fair market rents (county-level, annual), and FRED mortgage rates (weekly)
Campaign finance and immigration: TEC campaign contributions (34.6M rows of Texas political contributions), FEC federal data, DHS enforcement actions, and CBP border encounters
County Health Rankings is worth calling out on its own. It covers all 3,204 US counties with 18 metrics spanning income, health, and social factors in a single dataset. For campaign work, it’s the fastest way to get a snapshot of a county without pulling from four different sources.
Search for “county economic indicators” on OpenData and you get Census income, BLS unemployment, County Health Rankings, and HUD rents in the same result set. The platform understands that “poverty rate” and “children in poverty” are the same concept even when different agencies use different names for it.
What it looks like in practice
Nobody’s asking you to swap out your voter file vendor. But when you need federal numbers for a debate prep or a town hall, you need them fast and you need them right.
OpenData plugs into AI tools like Claude Desktop and Cursor as a data add-on. That means anyone with a Claude subscription can start asking questions about real government data and get answers back as charts and tables, no spreadsheet skills required. You don’t need a campaign data scientist to find these leads. Here’s what it looks like when a staffer needs town hall prep.
Every data point traces back to its original government source. When a staffer pulls an uninsured rate from OpenData, it’s the actual Census number, not something a model guessed from its training data. When the candidate stands on stage and says a number, the source URL exists. No hallucinated statistics, no unattributed claims.
The charts in this article were built with OpenChart, an open-source charting library designed for exactly this kind of thing: turning real data into visuals that people actually share. A chart showing child poverty ranging from 6% to 45% across Texas counties does more work than a paragraph explaining it. It gets screenshotted, texted to a colleague, dropped into a slide deck. Data visualizations grounded in real numbers generate engagement because they give people something concrete to react to, not abstract policy language.
Thursday morning
Thursday morning, you walk into the strategy meeting with four numbers: the uninsured rate from the Census, child poverty from Census county estimates, fentanyl deaths from the CDC, and a housing affordability ratio built by combining Census income with Zillow home prices. Each one traces back to its original government source.
The affordability chart that combines Census and Zillow data ran in under 5 milliseconds. The unemployment data that originally required four reference files to decode is a single search with readable results. The county health profiles for all 254 Texas counties are one filter.
Right now, every campaign and civic-tech platform that needs county-level numbers solves the same formatting problem from scratch. Download the files, fight the formats, reconcile the identifiers, hope nothing changed since last quarter. Most people just go with the statewide average because the alternative is a data cleanup project nobody has time for.
That cleanup work only needs to happen once. OpenData has already done it. And because it plugs into the AI tools people already use, the whole investigation is accessible to anyone on the team, not just the person who knows their way around a spreadsheet. Ask a question, get a chart backed by real data. That’s the workflow.
Every dataset in this article is free to query at tryopendata.ai with no signup required.
OpenData is in active development. The datasets in this article live at tryopendata.ai.