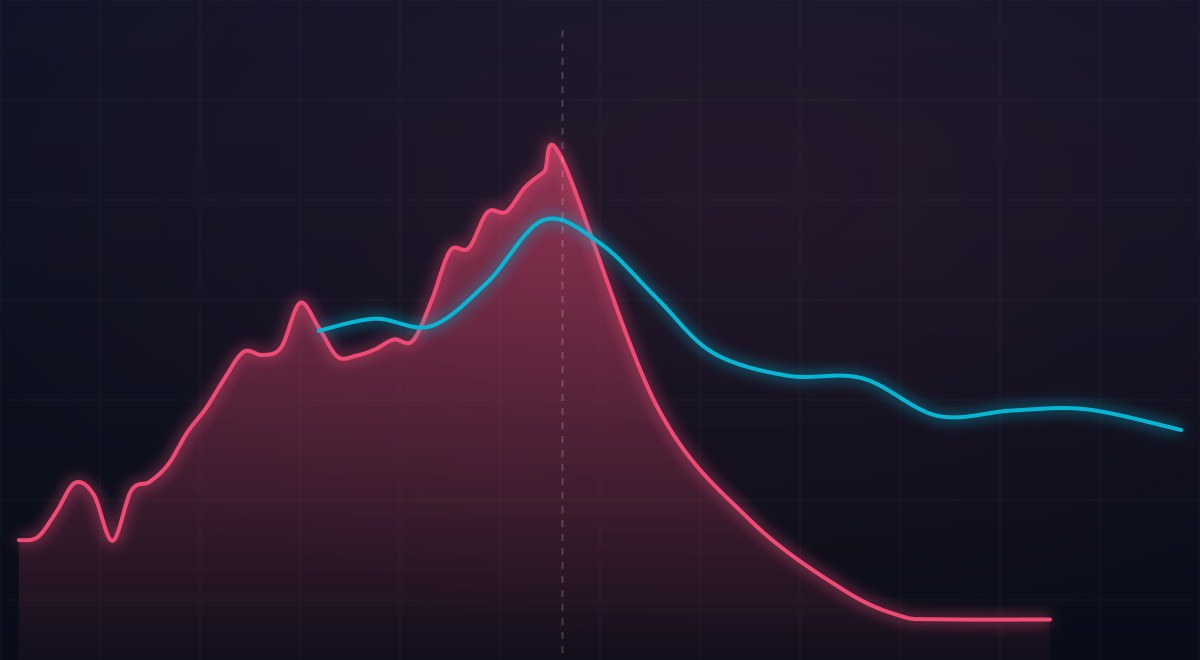

The share of American kindergartners who show up to school with both doses of the measles-mumps-rubella (MMR) vaccine has fallen to 92.5 percent, down from a pre-pandemic peak of 95.2 percent in 2019-20. That is the whole national move: 2.7 points over five years, according to the CDC’s SchoolVaxView survey of kindergarten immunization records. On a chart it barely tilts.
In 2009-10, six states reported kindergarten MMR coverage below 90 percent, the rough floor where measles starts to find room to spread. By 2024-25, 16 did. The national line drifted down a couple of points while the bottom of the distribution came apart, and in the states where it came apart, measles came back. The country logged 2,026 measles cases in 2025, its worst year in the CDC’s weekly case record, and another 1,602 in the first 17 weeks of 2026 alone. Three people died, two of them unvaccinated children in Lubbock, Texas. Measles had killed three Americans in the previous 22 years combined.
A national average hides its tails. This one hid 16 states falling below the herd-immunity threshold.
The average is the wrong number
Here is the national trend everyone quotes.
Coverage sat on a plateau around 94 to 95 percent for most of the 2010s, peaked at 95.2 percent right before the pandemic, then settled to 92.5 percent by 2024-25. Read as a single number, it looks like the country is a couple of points off where it used to be. The national figure is a population-weighted blur of 50 very different states, and California’s four million schoolchildren pull it toward stability no matter what happens in the smaller states. To see the change you have to stop averaging the states together and look at them one at a time.
The tail is where the story lives
Give every state its own dot, put the 95 percent herd-immunity line on the chart, and the same coverage data tells a different story. The cluster on the left, the states well under the line, is bigger and reaches further down than it did a decade ago.
In 2014-15, eight of the 50 reporting states sat below 90 percent, and the lowest, Colorado, was at 86.9 percent. In 2024-25, 16 of 49 reporting states were below 90 percent, and the lowest, Idaho, had fallen to 78.5 percent. The share of states under the 95 percent line rose from about two-thirds to about four-fifths over the same stretch. The national median coverage dropped from 94.0 to 91.3, about 2.7 points, the same slide as the population-weighted average but landing well below it, because the median sits in the middle of the pack while the average is pulled up by the biggest, higher-coverage states.
But states are still averages. A state at 91 percent could be uniformly at 91 percent, or it could be a mix of schools at 98 percent and schools at 50 percent. School-level data from 31 states, compiled by the Washington Post from state health department records, shows which version is closer to the truth.
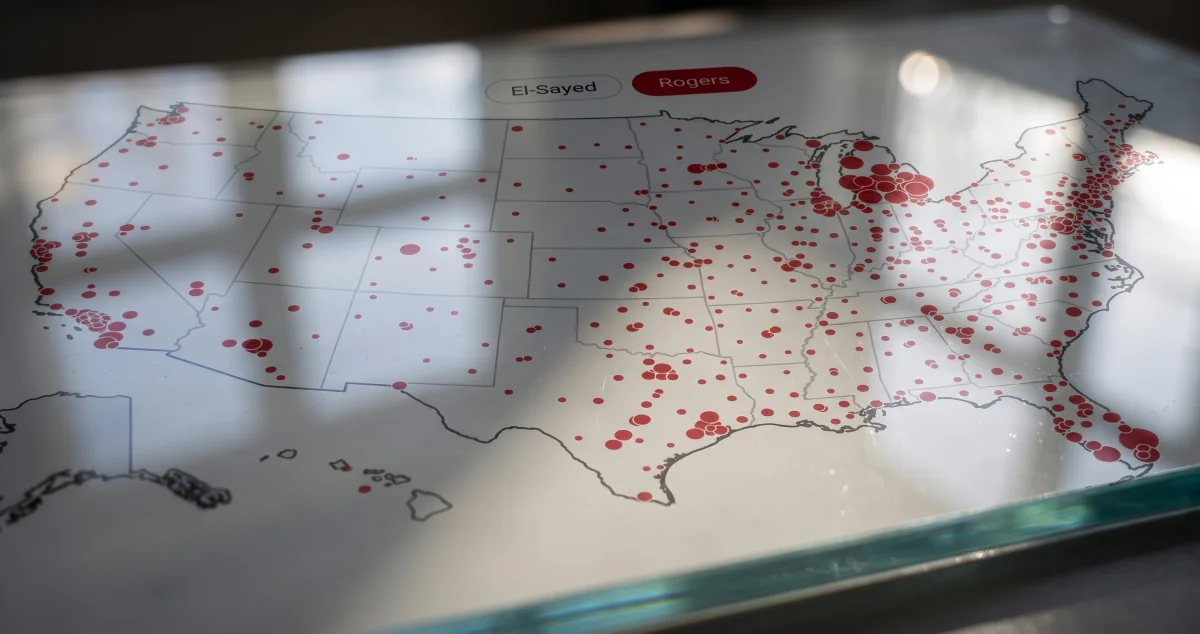
Of 36,404 schools with reported MMR rates, 8,289 sit below 90 percent. More than 3,000 are below 75 percent. The median school is at 95.7 percent, which is fine, but the distribution has a fat left tail that no state-level average captures. Five hundred schools reported coverage below 50 percent, meaning more than half of their incoming kindergartners lack complete MMR protection. Those schools are the pockets the state averages are hiding, and each one is its own potential outbreak site.
Counting the states that breached each line, year by year, makes the widening plain.
The count below 90 percent held in the low single digits through the 2010s, dropping as low as two states in 2018-19, then climbed every year after the pandemic to reach 16. Most of the country held roughly steady while a growing set of jurisdictions fell through the floor, which is the tail the national average obscures.
Idaho is the leading edge. At 78.5 percent kindergarten coverage, more than one in five of its incoming students lacks complete measles protection, and no state’s dot sits further left.
What changed was the opting out
A coverage drop can mean two very different things. It can mean families want the shots and cannot get them, which is a money-and-logistics problem. Or it can mean families are declining shots they could have had, which is a belief problem. These call for opposite responses.
Non-medical exemptions, the personal-belief and religious opt-outs a parent files to skip a required shot, more than doubled over the series, from 1.5 percent of kindergartners in 2009-10 to 3.4 percent in 2024-25. Medical exemptions, which need a doctor’s documentation, never moved: they held between 0.2 and 0.3 percent the entire time. Nothing about the medical picture changed. What changed is how many families filed paperwork instead of getting the vaccine, and the raw counts show the scale: the non-medical total rose from about 68,000 kindergartners in 2020-21, the first year the count is broken out, to nearly 129,000 in 2024-25.
The access story is not entirely wrong, though. A separate CDC survey, which interviews parents of toddlers rather than reading school records, finds a large and real gap by money and insurance.
Uninsured toddlers run about 14 points behind privately insured ones, and kids in households below 133 percent of the poverty line run about eight points behind kids above 400 percent. Poverty and lack of insurance genuinely do keep children from being fully vaccinated, and anyone who tells you otherwise is selling something.
But the gap barely moved over time. Between the two birth cohorts, coverage among uninsured toddlers went up, from 77.2 to 79.8 percent. Coverage among poor children held roughly flat. The access gap is wide and stubborn, but it is not what moved. Poverty and insurance explain which children are under-vaccinated in a given year, but almost nothing about why coverage slipped over the past five.
The exemption data explains the decline. Idaho, the state that has fallen the furthest, shows the separation most clearly.
Idaho’s two lines are near-perfect mirror images. Since its 2015-16 coverage peak, MMR coverage has fallen 11.7 points while non-medical exemptions have climbed 9.3 points. Nearly every point of protection the state lost turns up, on the same timeline, as a signed form. No clinic closed to produce that pattern. No vaccine went out of stock. Idaho parents were offered the same shot on the same schedule as everyone else, and a rising share of them wrote down that they did not want it. The same pattern repeats in every state where the tail is thickest.
It is not the tribe you think it is
Vaccine refusal looks like a red-state phenomenon, a product of one party’s politics. But look at who is actually at the top of the exemption table.
Idaho, Utah, Alaska, and the Dakotas are up there, and they are reliably Republican. So is Oregon, at 9.7 percent, which is not. So are Minnesota and Hawaii. Vermont and Washington built their exemption cultures long before the phrase “medical freedom” entered a stump speech, and the Pacific Northwest has been a soft spot for childhood vaccination coverage since the 1990s.
What these places share is a permissive exemption law and a local culture that treats the school immunization form as a matter of personal preference. Those arrive by different political roads. The crunchy-left version distrusts pharmaceutical companies; the libertarian-right version distrusts government mandates. They vote against each other in November and they file the same piece of paper in September.
But the balance between those two roads is shifting. Compare the states with the highest exemption rates in 2011-12 to the ones leading in 2024-25, and the change is hard to miss.
In 2011-12, five of the eight highest-exemption states voted Democrat in 2024: Oregon, Vermont, Michigan, Illinois, and Washington. By 2024-25, six of the top eight voted Republican: Idaho, Utah, Alaska, Arizona, North Dakota, and South Dakota. The crossover happened around 2018-2019, before COVID, before RFK Jr., before any of the politics that get blamed for the current moment. Measured as a correlation, the relationship between a state’s political lean and its exemption rate flipped from +0.28 in 2011-12 to -0.35 in 2024-25, and the growth in exemptions after 2019 correlated even more strongly with political lean than the pre-COVID change did.
This matters for more than fairness. A reader who decides this is the other team’s problem is a reader who stops checking their own kid’s school, and the whole point of the school-level distribution is that the risk is local. The pocket that matters to your child is the one your child sits in.
About 286,000 kids a year, and it stacks
The coverage percentages translate into an actual cohort of children, and the SchoolVaxView data carries its own enrolled-kindergartner counts, so no census estimate is needed. Multiply each state’s shortfall by its enrolled kindergartners and sum.
In 2024-25, about 286,000 kindergartners started school without complete two-dose MMR protection, up from roughly 205,000 in 2009-10. Measured against a 95 percent target rather than against zero, the country came up about 94,000 kindergartners short of what herd immunity would require in that single year. Every school year adds a fresh cohort, and the previous cohorts do not re-vaccinate on their own, so the pool of susceptible children accumulates. Net of the target, the state-level data implies a cumulative shortfall of more than half a million kindergartners since 2009-10, though that figure runs slightly high in the years coverage exceeded 95 percent and should be read as a shortfall against the target, not a precise headcount.
The point of the cohort math is timing. Today’s under-vaccinated kindergartner is not the patient in this year’s outbreak; measles is finding the accumulated pockets from years of opt-outs. Coverage below the line does not cause an outbreak the week it happens. It accumulates until an imported case lands in the right pocket.
The cases found the kindling
Measles was declared eliminated in the United States in 2000, meaning no sustained domestic transmission. The weekly case counts the CDC compiles through its National Notifiable Diseases Surveillance System (NNDSS) held to the low hundreds through 2024. Then 2025 broke the pattern.
The country recorded 2,026 measles cases in 2025, against a range of 47 to 266 in the three years before. By week 17 of 2026, late April, another 1,602 cases were already on the books, six times the entire 2024 total with most of the year still to run. The CDC’s own measles page, which updates faster than the weekly surveillance feed, counted about 2,170 cases as of July 2, 2026; the 1,602 figure here is the queryable NNDSS number through late April.
The geography tracks the tail, though loosely, and the looseness is itself informative. The 2025 wave centered on Texas, driven by an outbreak in Gaines County. In 2026 the leaders shifted to South Carolina and Utah, both high-exemption states. The state-level NNDSS data makes the geographic rotation visible.
Texas went from 288 cases in 2025 to 4 in early 2026. South Carolina went from 23 to 249. The virus did not stop spreading; it moved to the next pocket. Kansas, which logged 42 cases in 2025, reported none in the 2026 data, while Florida went from 2 to 74. The pattern is consistent: measles finds the under-vaccinated communities, burns through them, then moves on to the next one. A state’s turn as the headline depends on which of its pockets an imported case happens to land in.
Across states, the correlation between a state’s non-medical exemption rate and its per-capita case count is positive but modest (a Spearman rank correlation of 0.50, a Pearson of 0.28), consistent with the idea that measles does not spread evenly across a state. It spreads inside specific under-vaccinated communities. A state’s average exemption rate is a weak predictor for the same reason the national coverage average was: the action is in the pockets, not the mean.
What a case costs
Three people died of measles in the United States in 2025: an unvaccinated six-year-old in Lubbock, Texas, an unvaccinated eight-year-old who died of measles pulmonary failure weeks later, and an unvaccinated adult in Lea County, New Mexico. Neither child had an underlying condition.
Measles killed three Americans in 2025. It had killed three in the entire preceding 22 years.
About 11 percent of cases through late April were hospitalized, and 96 percent of them were in people who were unvaccinated or whose vaccination status was unknown, according to the CDC’s April 2025 surveillance update. Among the hospitalized, two-thirds were confirmed unvaccinated and almost all of the rest were unknown.
The disease is not sweeping through a vaccinated population and finding the vaccine wanting. It is landing, over and over, on the people who did not get the shot.
The money is not trivial either, and it does not come out of the objecting family’s pocket. Containing one measles case, which means tracing contacts, staffing a response, and quarantining the exposed, runs somewhere between about $33,000 and $59,000 depending on whose costs you count, according to a 2025 analysis of US outbreak costs. The 2019 outbreak in Clark County, Washington infected 71 people and cost about $3.4 million all in, roughly $47,000 a case, most of it absorbed by the public-health response rather than by anyone who declined a vaccine.
One unvaccinated traveler can oblige a county health department to spend a year’s discretionary budget in six weeks.
The people who don’t get a choice
Herd immunity is an unusual kind of public good: you cannot buy your child a private supply of it. It exists only if enough neighbors participate, which means the argument that vaccination is a purely personal decision runs into a specific group of people who have no decision to make at all.
Infants cannot get the measles vaccine until 12 months. Before that, a baby’s only protection is the antibodies that crossed the placenta and the immunity of the people around her. Roughly 3.6 million babies are born in this country every year, and they are the group measles hurts worst: hospitalization rates are highest in the youngest children.
Then there are the people whose immune systems cannot take a live vaccine, or cannot hold onto the protection if they do. Children in cancer treatment. Transplant recipients. People on immunosuppressive drugs for lupus or Crohn’s or rheumatoid arthritis. A 2024 study in JAMA put the share of American adults who are immunosuppressed at about 6.6 percent, more than double the older estimate.
That is millions of people whose only measles protection is the coverage rate of the people around them. When 500 schools report MMR coverage below 50 percent, the families who chose that are not the only ones who pay for it. The kindergartner with leukemia pays. So does the six-month-old in the pediatrician’s waiting room who is too young for the shot.
What a pocket looks like: Gaines County, Texas
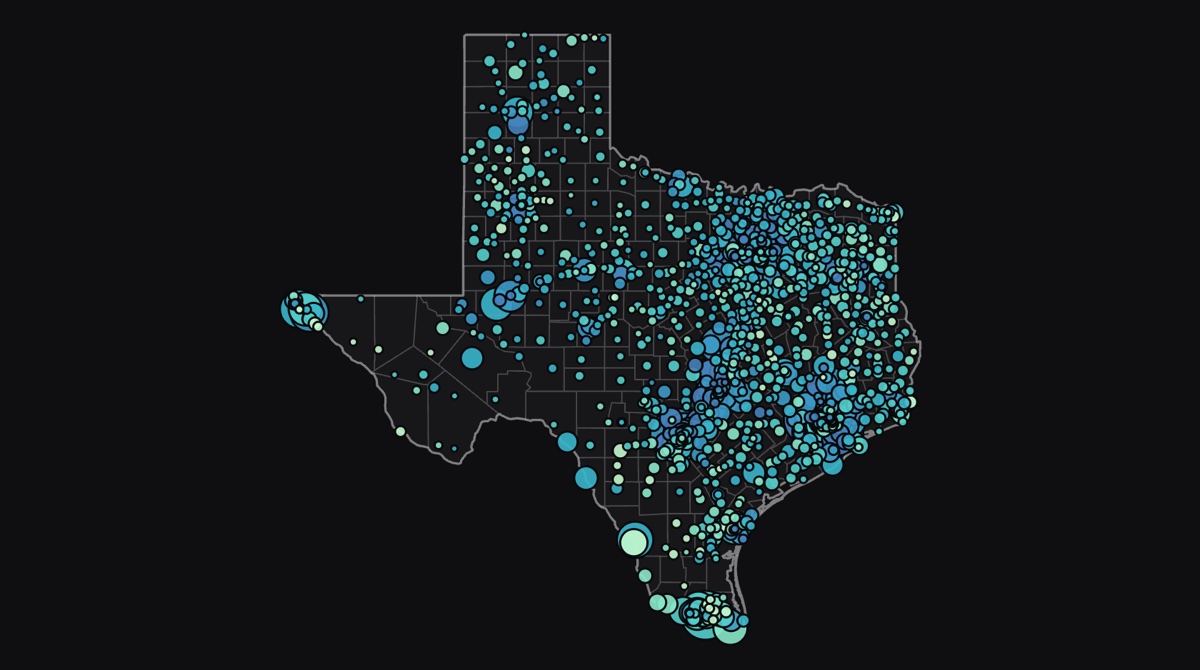
Texas is a useful place to watch the mechanism up close, because its Department of State Health Services reports conscientious-exemption rates county by county. Statewide, the typical Texas kindergartner’s exemption environment worsened steadily.
Weighted by county population, the rate a typical Texas kindergartner lives under roughly tripled, from 1.53 percent in 2013-14 to 4.97 percent in 2025-26. (The unweighted county average is higher, 6.14 percent, because small rural counties post double-digit rates on tiny denominators; the population-weighted figure is the honest statewide number.) A statewide 5 percent is not, on its own, alarming. The county detail is where the alarm is.
Gaines County reached 18.84 percent kindergarten exemptions in 2019-20, roughly one in five children, and it was still near 19.8 percent in 2025-26. It was a pocket well below herd immunity years before it became an outbreak headline. The growth is not only rural either. Suburban Montgomery, Collin, and Tarrant counties each added four to seven points of kindergarten exemptions over the same period.
The policy is the variable
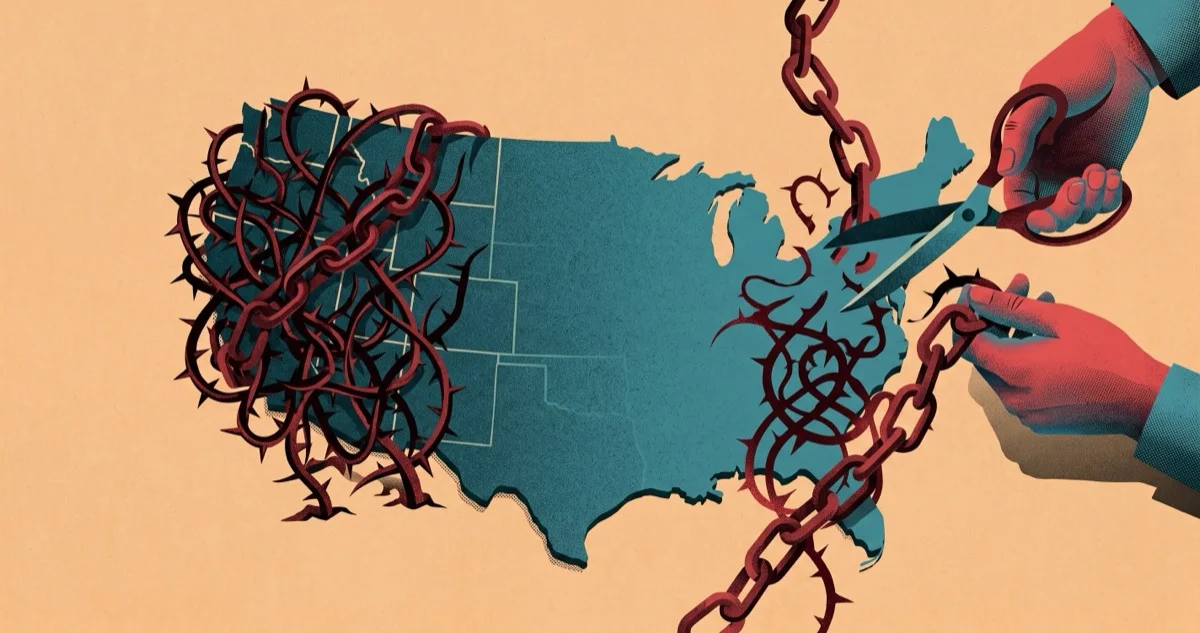
The coverage variation across states is not random. It tracks what the law allows. States that permit only medical exemptions have the highest kindergarten coverage. States that allow personal-belief or religious exemptions have the lowest. And the natural experiments of the past decade, where individual states changed their laws in one direction or another, confirm the relationship.
Only four states allow no non-medical exemptions at all. Twenty-six states allow religious exemptions but not philosophical ones. The remaining 21 jurisdictions, the District of Columbia among them, allow the broadest form, philosophical or personal-belief exemptions, where a parent can opt out for any reason. The map is the policy landscape the coverage data plays out on, and its geography overlaps with the coverage tail.
California was at 92.3 percent kindergarten coverage in 2013-14. SB 277, which eliminated personal-belief exemptions and took effect for the 2016-17 school year, pushed coverage to 97.3 percent, a five-point gain. It has stayed above 96 percent since. Maine followed a similar path: after eliminating non-medical exemptions in 2021, coverage climbed from 94.3 to 97.6 percent by 2024-25.
The opposite direction tells the same story. Mississippi ran at 99-plus percent for a decade with the strictest exemption policy in the country (medical only, no exceptions). After a court ordered the state to accept religious exemptions in 2023, coverage slipped to 97.6 percent, still high but the first sustained drop in the dataset. Idaho, which has never restricted non-medical exemptions and in 2025 signed the Medical Freedom Act prohibiting schools from requiring vaccines at all, fell from 89.5 percent to 78.5 percent over the series, the lowest of any state.
West Virginia, the other historically medical-only state, ran near 99 percent through 2018-19 before its governor signed an executive order allowing religious and personal-belief exemptions in January 2025. Its 2024-25 data was not reported to SchoolVaxView. The next year of data will show whether it follows the Mississippi pattern.
The evidence from these law changes is about as close to a controlled experiment as public health gets. The same population, in the same culture, with the same access to the same vaccine, responds differently depending on how easy the state makes it to opt out.
What COVID actually changed
The obvious question, looking at the charts above, is what happened around 2020. Every one of the coverage and exemption series has a visible hinge there: exemptions were flat at 2.2 percent through 2019-20 and then climbed every year afterward to 3.4 percent. The count of states below 90 percent bottomed out at two in 2018-19 and has risen every year since, to 16.
COVID accelerated this trend but did not start it. The trend predates the pandemic by a decade. Non-medical exemptions had already gone from 1.5 to 2.2 percent between 2009-10 and 2019-20, a 47 percent increase with no pandemic anywhere in it. Idaho’s non-medical exemptions doubled, from 3.5 to 7.2 percent, before COVID existed. Wakefield’s paper was 1998. The Disneyland outbreak was 2015. California passed SB 277 in 2015, in response to a problem that was already there. Whatever this is, it did not start in 2020.
Gallup has asked the same question since 2001: how important is it that parents get their children vaccinated? The answer used to be bipartisan.
In 2001, 93 percent of Republicans and 97 percent of Democrats said vaccinating children was extremely or very important. The gap was four points. By 2015, after the Disneyland measles outbreak, both parties had drifted down but remained within six points of each other (Republicans 82 percent, Democrats 88 percent). By 2019, the last pre-COVID wave, the gap had widened to 13 points (79 vs. 92 percent), still a majority in both camps but pulling apart. Then COVID hit, and the gap blew open: by 2024, Democrats held at 93 percent while Republicans dropped to 52 percent, a 41-point split.
The pre-COVID drift matters because it means the pandemic accelerated something that was already moving. A four-point gap in 2001 became a 13-point gap by 2019 with no pandemic, no CDC controversy, and no RFK Jr. in the cabinet. COVID bent the curve sharply downward on the Republican side, but the curve was already bending.
Institutional trust moved the same way, faster.
Republican trust in the CDC on vaccines fell from 90 percent in March 2020 to 40 percent by September 2023, according to KFF tracking polls. Then the administration changed, and it was Democratic trust that dropped: from 88 percent in September 2023 to 55 percent by January 2026, while Republican trust ticked back up. A separately worded Harvard poll finds the same reversal more starkly still, with Republicans now expressing more confidence in CDC recommendations than Democrats do.
Each party’s confidence in the country’s public-health agency tracks whether its own side is running that agency. Americans did not develop a considered skepticism of epidemiology somewhere around 2021. They outsourced their opinion of the CDC to their opinion of the president, and both parties have now done it, in turn, inside of six years.
When trust in the vaccine schedule tracks the last election rather than the evidence behind it, the schedule stops functioning as a medical document.
Support for the school requirement itself moved with it. Pew’s share of Americans backing MMR requirements for public school fell from 82 percent in 2019 to 69 percent in 2025, and nearly all of the drop came from one side: Republican support went from 79 to 52 percent while Democratic support held. The share of Republican parents who say they have skipped or delayed a childhood shot doubled, from 13 percent in 2023 to 26 percent by early 2025.
So COVID is an accelerant, not the ignition. It changed what legislatures were willing to do. Idaho passed its Medical Freedom Act in 2025. West Virginia’s governor opened religious and personal-belief exemptions by executive order the same year, ending a century of one of the strictest laws in the country. A court forced religious exemptions onto Mississippi in 2023. The politics moved first, the law moved second, and coverage followed the law.
The federal picture is genuinely unsettled as of this writing, and worth stating carefully because it is moving. Robert F. Kennedy Jr. was confirmed as Health and Human Services Secretary in February 2025. In June 2025 he removed all 17 sitting members of the CDC’s vaccine advisory committee. In January 2026 the CDC narrowed the universal childhood immunization schedule from 17 diseases to 11, though MMR itself remained on the universal list. That change did not survive contact with the courts: in March 2026 a federal judge stayed the new schedule and stayed 13 of the advisory-committee appointments as likely procedural violations. HHS appealed in April, and the appeal is pending. Anyone telling you confidently what the federal childhood vaccine schedule will look like in a year is guessing.
None of that federal turbulence has yet shown up in the coverage data, which stops at the 2024-25 school year. The laws that will determine the next five years of kindergarten coverage are being written right now, and the coverage numbers that would tell us how it is going will arrive two years late.
The best case against all of this
Here is the strongest version of the other side.
Start with the fact that the vaccine is not risk-free, because nothing is, and the specifics are worth stating rather than waving away. MMR causes febrile seizures in roughly four of every 10,000 children vaccinated at 12 to 23 months. The combined MMRV shot roughly doubles that rate, which is exactly why the CDC changed its recommendation to prefer separate shots for the first dose: the agency found a real harm in its own data and acted on it. Severe allergic reactions occur somewhere between roughly 1 and 14 times per million doses, depending on whose surveillance you read. Vaccine-related low platelet counts run about 1 in 22,300 doses. The United States runs a federal vaccine-injury compensation program precisely because a policy that vaccinates tens of millions of children will, occasionally, hurt one of them.
None of those numbers is zero, and a parent who has watched their child seize is not going to be talked out of what they saw. Any honest case for mandates has to concede that a small number of families pay a real price so the rest of us can walk around inside a disease-free population.
Measles itself causes encephalitis in about 1 of every 1,000 infected children; the vaccine causes it in something like 1 per million doses. Rubella infection causes low platelet counts in roughly 1 in 3,000; the vaccine, 1 in 22,300. Measles kills one to three of every 1,000 infected children. The risk does not disappear when you decline the shot. It gets substantially larger and moves onto a different child.
Institutional distrust was earned. Public-health authorities have, at various points, run the Tuskegee study, released a defective polio vaccine in the Cutter incident, and taken decades to act on the marketing of opioids. A parent who says “you have been confidently wrong before” is making a claim with evidence behind it. And the deepest version of the objection is not empirical at all: it holds that a parent’s authority over what enters their child’s body is a matter of conscience, and that a state which can compel this injection has, in principle, claimed the power to compel the next one.
The autism claim, which is the load-bearing empirical premise for most vaccine refusal, is not a live scientific question. It came from a 1998 paper by Andrew Wakefield that studied 12 children, was funded in part by lawyers preparing to sue vaccine manufacturers, was fully retracted by The Lancet in 2010, and cost its author his medical license. It has since been tested about as thoroughly as any hypothesis in modern medicine, including a Danish cohort study following 657,000 children that found no increased autism risk from MMR, none in the subgroups thought to be susceptible, and no clustering of diagnoses after vaccination. The belief survives; the evidence for it does not.
The autonomy argument is stronger, and it fails for a different reason: the choice is not confined to the person making it. Declining a vaccine is not like declining a helmet. It changes the risk faced by the six-month-old and the child on chemotherapy who never got a vote, and unlike most personal decisions, it gets more dangerous as more people make it. Personal liberty is the right framework when the costs land on the chooser. Declining a vaccine shifts risk onto infants and immunocompromised children who had no say in the decision.
Which leaves the practical objection, and it deserves a straight answer: do mandates simply drive angry parents into medical exemptions or homeschooling instead? The data says mostly no. California’s medical exemptions did tick up after SB 277, which is why the state tightened the medical-exemption process in 2019. But medical exemptions nationally never moved off 0.2 percent, and California’s coverage did not just spike and fall back. It went to 97.3 percent and has stayed above 96 percent for nearly a decade. The families did not all find a workaround. Most of them got the shot.
Where the US sits globally
The United States is not the only country watching its measles defenses weaken. First-dose measles vaccine coverage varies widely across developed nations, and the trajectories over the past decade are moving in different directions.
The United Kingdom went from 93 percent first-dose coverage in 2014 to 89 percent in 2024 and lost its WHO measles elimination status in 2026. Canada, which hovered around 90 percent for most of the period, lost its elimination status in November 2025 after the virus circulated continuously for more than 12 months. Six European countries, including the UK, Austria, Spain, and Armenia, lost elimination status based on 2024-2025 case data.
The US sits at 92 percent first-dose coverage, flat over the decade. It is below Germany (96 percent), Japan (95 percent), and France (which improved from 91 to 95 percent after tightening its own mandate). The Pan American Health Organization is expected to review the US elimination status around November 2026.
Italy offers a case study from the other direction. Its MCV1 coverage dropped from 91 percent in 2010 to 85 percent in 2015, triggering outbreaks, and the government responded with a mandatory vaccination law in 2017. Coverage climbed back to 95 percent by 2024. The Italian path, like California’s, suggests the trend is reversible when the policy moves.
A second measure agrees
Two independent CDC instruments measure vaccination coverage, and it is worth checking they tell the same story. SchoolVaxView, used throughout this piece, tallies kindergarten immunization records. The separate National Immunization Survey (NIS) instead surveys parents of toddlers and reports coverage by 35 months of age. They sample different children with different methods, so agreement between them is a credibility check rather than an echo.
They agree. NIS 35-month MMR coverage runs in the low-to-mid 90s across the 2011 through 2021 birth cohorts, the same band SchoolVaxView shows for kindergartners, and neither instrument shows a coverage collapse in the national aggregate. Both show the same gentle national slip, which is exactly the point. The aggregate is genuinely calm in both measures. The tail is what moved, and you only see the tail when you stop trusting the average to speak for the distribution.
Pertussis tells the same story
Measles gets the headlines because it spreads the fastest and its outbreaks are the most visible. But the same coverage gaps show up in another vaccine on the same childhood schedule, and another disease is surging on the same timeline.
Pertussis, whooping cough, follows a natural epidemic cycle of three to five years. The last major peak was 2012, when the US reported 48,277 cases, the most since the 1950s. Smaller peaks followed in 2014 (32,971) and 2019 (18,617). Then COVID-era distancing suppressed transmission: cases dropped to 3,448 in 2022. What came next was not a normal cyclical rebound.
In 2024, pertussis cases hit 44,578, nearly matching the 2012 record and roughly 13 times the 2022 level. Some of that is cyclical rebound, some is a post-pandemic snapback. But the magnitude is harder to explain by cycle alone, and the geography is suggestive: the states reporting the most pertussis overlap heavily with the states showing the steepest drops in DTaP kindergarten coverage.
DTaP kindergarten coverage in 2024-25 tracks almost identically to MMR: the bottom five states for DTaP (Idaho at 78.3%, Indiana at 81.7%, Alaska at 82.2%, Wisconsin at 85.7%, Kentucky at 86.2%) are nearly the same states at the bottom of the MMR list. The two vaccines sit on the same schedule, go through the same exemption process, and get refused by the same families. A parent who files a personal-belief exemption typically opts out of the full set, not one shot at a time.
The pertussis comparison matters because it controls for the “measles is special” objection. Measles is extraordinarily contagious, which means even small coverage gaps produce outbreaks. Pertussis is less contagious but its immunity wanes faster, making it more sensitive to population-level coverage drops over time. Both diseases are surging, on the same timeline, in the same states, driven by the same exemption trends. The pattern is not one disease getting unlucky. It is the vaccine infrastructure losing ground.
What elimination took
The current numbers are easier to read against the scale of what the vaccine accomplished. Before the first measles vaccine was licensed in 1963, the United States reported 400,000 to 763,000 measles cases a year, and actual infections ran far higher, an estimated three to four million annually, because most cases were never reported. Measles killed 400 to 500 Americans a year, the majority of them children.
Cases dropped from 385,000 in 1963 to 22,000 by 1968, a 94 percent reduction in five years. The combination MMR vaccine in 1971 simplified delivery. A resurgence in 1989-91 (55,000 cases, 123 deaths, concentrated in unvaccinated preschool children) prompted the two-dose recommendation. After that, cases fell below 100 a year and the CDC declared measles eliminated in 2000.
The 2025 total, whether you take the CDC’s 2,065 confirmed cases or the roughly 2,000 to 2,300 the various surveillance series land on, is a rounding error on the pre-vaccine scale. It does not look like a rounding error to the families in Gaines County, Spartanburg, and southwest Utah. Whether this resurgence stays small or grows depends on what happens with exemption laws. The exemption data, the school-level distribution, and the policy experiments all point the same way.
Where the tail is heading
Coverage data stops at the 2024-25 school year; the cases run into 2026 and are still climbing. The under-vaccinated kindergartners counted here have not yet aged into the population getting infected, which means the pockets already on the books are set to widen before any policy could narrow them. Federal health officials are expected to weigh the country’s elimination status, earned in 2000, this fall. The arithmetic they will be working from is the 16 states below 90 percent coverage and the counties already sitting at one-in-five exemptions, waiting for the next imported case to land somewhere the vaccine hasn’t.
That arithmetic does not resolve at the national level. There is no such thing as being 92.5 percent protected. Your child is not enrolled in the United States; she is enrolled in a building, in a county, with a specific coverage rate that may be 98 percent or may be 60 percent, and the national average will tell you nothing about which. A population-weighted average stays calm by construction while the places underneath it stop being safe.
Which is why the useful response to all of this is smaller and more local than the headline suggests. The Washington Post’s school-level data covers 31 states, and the exemption rates in it are public records. The number that determines whether an imported case becomes an outbreak in your kid’s school is the number for your kid’s school.
Datasets used:
cdc/kindergarten-vaccination-exemptions— CDC SchoolVaxView kindergarten MMR coverage and vaccine-exemption rates, national and state, 2009-10 through 2024-25.cdc/nndss-weekly-cases— CDC National Notifiable Diseases Surveillance System weekly case counts, measles (indigenous and imported), 2022 through 2026 week 17.tx-dshs/conscientious-exemptions— Texas Department of State Health Services county-level conscientious (non-medical) exemption rates by grade, 2013-14 through 2025-26.census/county-population— Census county population estimates, used only to population-weight the Texas county exemption rates.cdc/vaccination-coverage— CDC National Immunization Survey (NIS) toddler MMR coverage by 35 months. Used to cross-check the SchoolVaxView topline, and to break coverage out by insurance status and household income for the access analysis.owid/measles-cases-and-deaths— Our World in Data compilation of US measles cases and deaths by year, 1919-2025, from CDC and WHO surveillance records.washingtonpost/school-vaccination-rates— School-level kindergarten vaccination rates for 31 states, compiled by the Washington Post from state health department records, 2023-24 and 2024-25.owid/vaccination— WHO/UNICEF Estimates of National Immunization Coverage (WUENIC), first-dose measles vaccine (MCV1) coverage by country and year.ncsl/vaccine-exemption-laws— National Conference of State Legislatures classification of which non-medical vaccine exemption types each state permits for school immunization requirements.kff/cdc-trust-by-party— KFF tracking-poll figures for trust in the CDC by political party, 2020 through January 2026, compiled from KFF’s published toplines for this article. Thequestion_seriescolumn flags which of KFF’s two question wordings each figure comes from.- Gallup childhood vaccination importance polls (2001, 2015, 2019, 2024) — “How important is it that parents get their children vaccinated?” Topline and party breakdowns from Gallup articles poll/4768 (2001), poll/181844 (2015), poll/276929 (2019), and poll/648308 (2024). Not an OpenData dataset; compiled from Gallup.com published articles.
- Our World in Data pertussis API (CDC MMWR) — Historical US pertussis case totals, 1922-2022, used for pre-NNDSS cycle peak comparisons (2004, 2005, 2010, 2012, 2014, 2019). Not an OpenData dataset; accessed via the OWID grapher API (indicator 1014796).
Methodology:
State counts and the strip charts exclude three city sub-jurisdictions (New York City, Houston, San Antonio) that SchoolVaxView reports separately and that double-count inside their states. Coverage and exemption figures are survey estimates, not censuses, and are reported to a tenth of a point. The cohort counts multiply each state’s coverage shortfall by that state’s own enrolled-kindergartner count from the same dataset, then sum; the “shortfall against 95 percent” figure measures the gap to a herd-immunity target rather than to full coverage. Measles case totals sum both indigenous and imported forms and normalize the surveillance system’s mixed-case jurisdiction labels; NNDSS is provisional and lags, so 2026 covers only through week 17 (late April). The July 2026 case figure comes from the CDC’s measles page, which updates faster than the weekly feed, and is attributed as such. The exemption-to-case relationship is a state-level correlation only; measles clusters in sub-state communities, so no causal claim is made. The partisan crossover chart shows the top 8 states by non-medical exemption rate in 2011-12 and 2024-25, colored by their 2024 presidential result (AP certified). The correlation figures cited in the prose (r = +0.28 in 2011-12, -0.35 in 2024-25) are Pearson r computed across n=46 states between Biden 2020 margin (held constant as a political-lean measure) and each state’s exemption rate; DC and states missing data in any year are excluded. The correlation is ecological (state-level), not individual-level. The Texas statewide rate is population-weighted by 2024 county population; the unweighted county average runs higher because small counties post extreme rates on tiny denominators. School-level data covers 36,404 schools across 31 reporting states and combines the 2023-24 and 2024-25 school years; schools with zero or null MMR rates are excluded. The international comparison uses first-dose MCV1 coverage from WHO/UNICEF WUENIC estimates, which differs from the two-dose kindergarten coverage used in the US state-level analysis. The historical case series from Our World in Data compiles multiple surveillance sources across different reporting eras; pre-1960s figures reflect voluntary reporting and undercount actual infections. WHO elimination status determinations are from regional verification commission announcements; the 2026 European losses were announced in January 2026, and Canada’s loss was announced in November 2025.
On the three different 2025 case counts. This article’s case charts come from NNDSS, the CDC’s weekly surveillance feed, which totals 2,026 measles cases for 2025. The CDC’s separately-maintained measles page reports 2,065 confirmed cases for the same year, and the Our World in Data compilation used for the historical chart carries 2,289. These are three surveillance products with different inclusion rules, reporting lags, and confirmation standards, and they do not reconcile exactly. Rather than launder them into one number, each chart is labeled with the series it uses, and the prose avoids asserting a single 2025 total as settled fact. The disagreement is on the order of 10 percent and changes nothing about the trend.
Claims sourced outside the datasets. Several figures come from published literature and outbreak reporting rather than a queryable dataset, and are linked inline where they appear. The 2025 death toll (three: an unvaccinated six-year-old and an unvaccinated eight-year-old in Lubbock, Texas, and an unvaccinated adult in Lea County, New Mexico; no age was publicly confirmed for the New Mexico adult and none is stated here), the 11 percent hospitalization rate, and the 96 percent of cases in people unvaccinated or of unknown vaccination status come from the CDC’s MMWR measles update covering January 1 to April 17, 2025. The comparison that measles killed three Americans in 2025 versus three in the preceding 22 years uses CDC’s own tally of deaths in 2003 (two) and 2015 (one). Outbreak containment costs come from a CDC-authored systematic review of 11 US outbreaks 2004-2017 (median $32,805 per case, public-health-agency costs only, which excludes medical costs and so understates the true figure) and from the 2019 Clark County, Washington outbreak (about $3.4 million). The finding that state and local agencies absorb roughly 97 percent of response costs comes from the Clark County cost analysis in Pediatrics (2021). The immunosuppression prevalence figure (about 6.6 percent of US adults) comes from Martinson and Lapham, JAMA 2024, which roughly doubled the older 2.7 percent estimate; it covers adults only. The annual births figure (about 3.6 million) is CDC/NCHS provisional 2024 data and is used as an approximation for the number of infants under 12 months, not as an exact count. No published figure exists for the total share of Americans medically ineligible for MMR, and none is claimed here.
Vaccine risk and autism figures. Febrile seizure rates (about four per 10,000 for MMR at 12-23 months, roughly doubled for the combined MMRV shot), anaphylaxis (roughly 1 to 14 per million doses, a range across surveillance sources), thrombocytopenia (about 1 in 22,300 doses versus roughly 1 in 3,000 from rubella infection), and encephalitis (about 1 per million doses versus about 1 per 1,000 measles infections) come from CDC vaccine-safety documentation and the CDC Pink Book. The autism findings come from the 2010 Lancet retraction of Wakefield et al., the General Medical Council’s erasure of Wakefield from the medical register in May 2010, and the 657,461-child Danish cohort study published in Annals of Internal Medicine in 2019 (hazard ratio 0.93, 95% CI 0.85-1.02).
Polling and federal policy. The Gallup vaccine-importance chart uses the “extremely + very important” combined metric by party from four Gallup survey waves (2001, 2015, 2019, 2024). The 2001 article (poll/4768, June 28-July 1, 2001, n=1,015, MOE ±3 pts) reported 94% overall with no party breakdown at time of publication; party splits for 2001 and 2015 come from retrospective trend tables published in the 2019 release (poll/276929) and the 2024 release (poll/648308). The 2019 release (Dec 2-15, 2019, n=1,025, MOE ±4 pts) was the first wave to publish party breakdowns in its original article. Trust and vaccine-attitude figures come from KFF tracking polls, Pew (November 2025), and the Harvard Chan/de Beaumont poll (June 2026); each is linked inline. The CDC-trust chart plots the KFF series only, and deliberately does not splice in the Harvard numbers: the two polls ask differently worded questions (KFF asks about trust in the CDC “to provide reliable information about vaccines”; Harvard asks about trust in CDC health recommendations) and return different levels, so combining them into one line would manufacture a trend neither poll measured. The chart’s points are the published KFF waves (Republicans 90 percent in March 2020 and 40 percent in September 2023; Democrats 88 percent in September 2023, 64 percent in September 2025, and 55 percent in January 2026, with Republicans at 43 percent in that same January 2026 wave). The gaps between waves are not interpolated, and the line connects only observed points. The administration shading marks which party held the executive branch (and therefore the CDC), with the transitions at the January 2021 and January 2025 inaugurations. That shading is context for the reader, not a claim that the administration alone caused the movement. The federal timeline (RFK Jr.’s confirmation in February 2025, the removal of all 17 ACIP members in June 2025, the January 2026 schedule change, and the March 2026 federal court stay of that change and of 13 ACIP appointments, with HHS’s appeal pending) is current as of July 2026 and is explicitly described as unsettled. The January 2026 schedule narrowing is not described as operative policy because it was stayed. The 2024 presidential results used to color the exemption-politics chart come from election returns, not from the vaccination data.
The pertussis section stitches two sources: historical cycle-peak case counts (2004-2019) come from Our World in Data’s compilation of CDC MMWR data, accessed via the OWID grapher API (indicator 1014796); current case counts (2022-2025) come from CDC NNDSS weekly surveillance, the same source used for measles. The two datasets use different collection methods (annual summary vs. weekly reporting), so minor discrepancies are expected for overlapping years; the 2022 NNDSS total (3,448) is slightly higher than the OWID figure (3,044) because NNDSS sums weekly reports while OWID uses the finalized annual total. The pertussis tilemap combines 2024 and 2025 NNDSS data; 2025 is provisional. States with null or zero reported cases are shown as “no data” because NNDSS reporting completeness varies by state. The DTaP coverage comparison uses the same CDC SchoolVaxView kindergarten data as the MMR analysis, with the vaccine filter changed to “DTP, DTaP, or DT.”
All datasets are queryable at tryopendata.ai. Every chart above carries its source query.