
- 01Residential electricity in Washington, D.C. is up 64.5% since 2022, and Maryland more than 40%, against a national rise of 18.5%.
- 02The eight PJM-core states rose 34% on average since 2022. The other 43 states rose 15%. Being in the grid region predicts your bill; having data centers does not.
- 03PJM's independent market monitor attributes 82% of the latest capacity auction increase to data-center demand.
- 04Data-center floor space explains about 3% of the variation in state price changes. Virginia has the most floor space in the country and a below-average increase. Maryland has one percent of Virginia's floor space and rose 40%.
- 05Texas added about 48 GW of new generating capacity since 2020 and kept wholesale prices in their pre-boom range. Virginia added 4 GW, and PJM's capacity price jumped tenfold.
- 06PJM socializes capacity costs across 13 states and the District, so a server hall in Loudoun County raises the bill for a household in Ohio.
A household in Washington, D.C. paid about 14.3 cents for a kilowatt-hour of electricity in 2022. Over the year that ended this spring, the same household paid 23.5 cents. That is a 64.5 percent increase in a little over three years, at a time when overall consumer prices rose about 18 percent. Just across the line in Maryland, residential rates climbed more than 40 percent. The national average rose 18.5 percent.
For most of the past decade, electricity was the boring line on the household-cost chart, rising slower than groceries, rent, or almost anything else a family buys. According to federal price data, it has become one of the fastest-rising major costs in the American budget, and the increases are landing hardest in a specific band of the country.
The obvious suspect is the data-center boom. Server farms for artificial intelligence draw enormous amounts of power, so the places building them should be the places where prices spiked. Data centers really are driving the cost, and PJM’s own market monitor now says so in plain language. But an analysis of two decades of Energy Information Administration retail-price records, federal inflation data, utility capital filings, PJM’s capacity-auction results, and a facility-level inventory of American data centers shows that the steepest increases cluster around the wholesale electricity market that surrounds the data centers, not around the buildings themselves. That market spreads the cost across 13 states and the District, including plenty of homes nowhere near a server rack.
Through 2024 the District and Maryland ran a cent or two above the national average and moved with it. Then D.C.’s price rose 11 percent between May and June 2025, from 20.4 cents to 22.7, and never came back down. It has been at or above that level every month since, reaching 25.4 cents by April 2026.
June 1 is when PJM’s new capacity year starts.
Electricity versus inflation
Measured against the consumer price index for the whole country, electricity spent the 2010s falling behind. From 2015 to about 2021 the price of a kilowatt-hour rose more slowly than prices in general; anyone tracking their budget would have filed power under “the bill that doesn’t change much.”
Since January 2022, the electricity index has risen about 28 percent while all consumer prices rose about 18 percent. Run the same comparison over the seven years before that, and electricity is the laggard, up roughly 14 percent while everything else rose 20 percent. A six-point deficit became a ten-point premium in a little over four years.
Geography of the increases
If data centers drove the increases, the map should light up in the places famous for building them: Northern Virginia, Georgia, Texas, Arizona. It doesn’t. Georgia’s residential rates rose 9 percent since 2022, half the national pace. Texas rose 15 percent, also below average. Nevada fell. The states with the steepest increases share something else: they sit inside PJM Interconnection, the wholesale grid that runs from the Mid-Atlantic through the Ohio Valley and into Chicago.
Group the states and the pattern sharpens. Across the eight jurisdictions where PJM serves nearly all the load (D.C., Maryland, New Jersey, Delaware, Pennsylvania, Ohio, Virginia, and West Virginia), residential prices rose 34 percent on average since 2022. Across the other 43 states, they rose 15 percent. The split holds up when you drop D.C., when you add Illinois, and when you weight by how much power each state’s households actually buy; the PJM group lands somewhere between 30 and 34 percent every way you cut it, roughly double the rest of the country.
PJM runs a capacity auction once a year. Power plants bid to promise they will be available on the hottest and coldest days, and whoever wins gets paid a daily rate for that promise. Think of it as an insurance premium the grid pays generators to keep the lights on during the worst weather.
For the delivery year that began in June 2025, that daily rate jumped from roughly $29 to about $270 per megawatt-day, according to Utility Dive’s reporting on the results. The zone covering Baltimore hit the auction’s price cap. The total cost across PJM rose from $2.2 billion to $14.7 billion. Those costs flow into the “standard offer” rates that utilities charge residential customers, which is why Maryland’s Office of People’s Counsel projected household hikes as steep as 24 percent when the new rates took effect on June 1, 2025, exactly where the two lines in the first chart break away.
PJM’s independent market monitor, the watchdog that audits the auction, says data centers are the primary reason. It puts a number on the claim: data-center demand drove $7.3 billion of the increase in the 2026/27 auction, about 82 percent.
Other forces pushed in the same direction. Generators are retiring faster than replacements can get built. In January 2024, the Federal Energy Regulatory Commission (FERC) approved PJM’s Critical Issue Fast Path reforms, which cut the amount of capacity that solar, wind, and batteries could sell into the auction because those resources do not always show up on the worst days. The reforms responded partly to widespread generator failures during Winter Storm Elliott in December 2022. But PJM estimates those rule changes explain less than 20 percent of the capacity shortfall between the two auctions; data-center load explains the rest. PJM’s forecast of peak demand jumped by more than 5,400 megawatts in a single year, which the operator attributes largely to data-center expansion.
The pressure showed up locally before it showed up everywhere. A year before the headline spike, in the 2024/25 auction, the system-wide price was a quiet $28.92 per megawatt-day.
DPL South, covering southern Delaware, cleared at $426.17.
The next year it spread. Baltimore’s zone hit $466.35, the auction’s price cap. Dominion, the zone containing northern Virginia’s Data Center Alley, hit $444.26. The system-wide price was $269.92, so the zones closest to data centers were paying nearly double. That gap is how the auction is supposed to work: higher prices in the places where power is scarcest, lower prices where there is room to spare.
Then in 2026/27 the gap closed. Every zone cleared at exactly $329.17, whether it had data centers or not. Baltimore, Chicago, and northern Virginia all paid the same price because the shortage had spread from a few hot spots to the entire grid.
The prices never came back down.
The $270 auction was reported as a shock, which implies a return to normal. There wasn’t one: the next two auctions cleared at $329.17 and $333.44, both above the number that made headlines.
Counting the buildings
If data centers drive the bills, the states with the most data-center floor space should be the states where bills rose most.
Employment looks like a natural proxy, because the Bureau of Labor Statistics publishes it, but Loudoun County, Virginia shows why it fails.
Loudoun holds the densest concentration of data centers on Earth, the corridor the industry calls Data Center Alley. The federal data that counts data-center jobs recorded about 1,550 of them there in 2024, down from roughly 2,100 in 2019. Employment fell while power demand climbed. A hyperscale hall can draw hundreds of megawatts with a few dozen staff on site, so a jobs map is blind to the load.
Floor space tracks the load directly. The Department of Energy’s IM3 project maintains a facility-level atlas of American data centers, mapping 1,239 individual buildings with their footprints. In that data Loudoun is impossible to miss: 189 buildings totaling 28.2 million square feet, three times the next county in the country.
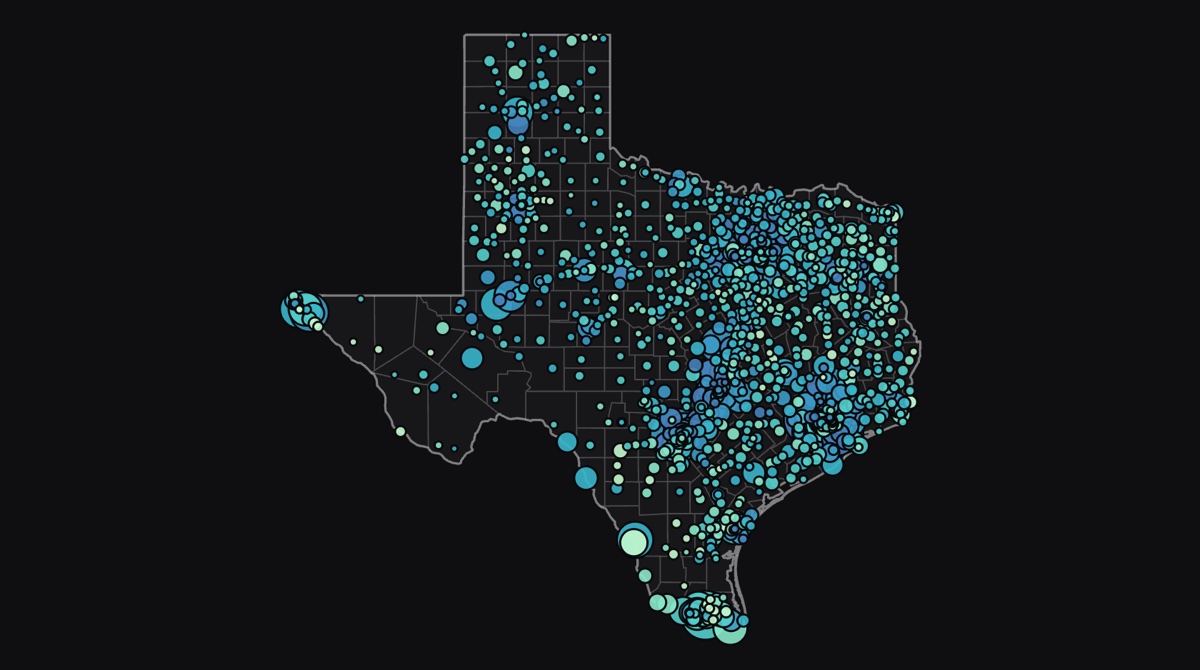
The map below shows where the buildings are.
731 buildings, coast to coast
731 buildings, coast to coast
Every dot is a data-center building of at least 100,000 square feet, sized by floor space. They are genuinely national. Big clusters sit in central Oregon, outside Phoenix, in Iowa, along the Texas plains, and across the Southeast, in states whose residential rates have gone almost nowhere.
A third of the floor space sits in one market
Now color by grid region. The pink dots are in the eight jurisdictions where PJM serves nearly all the load. They hold 301 of the 731 buildings and about 35 percent of the mapped floor space. That leaves roughly two-thirds of America's data-center square footage outside the market whose prices moved most.
The densest square mile in the country
Zoom into northern Virginia and the cluster resolves into 144 individual buildings packed into a few miles of Loudoun County, more floor space than any other county in America by a factor of nearly three. This is the place the phrase Data Center Alley describes, and the place a jobs map recorded as shrinking.
The bill does not follow the buildings
Back out to the whole country. Virginia holds the most data-center floor space in America and saw a below-average price increase. Maryland, next door, has about one percent as much floor space and one of the largest increases in the nation. The dots explain where the load is. PJM's boundary explains where the cost lands.
And the next wave lands in the same place
These dots are different: they are not buildings but modeled locations, from a Department of Energy siting model that asks where new data centers could plausibly go. In its central scenario, 100 of 328 projected sites fall inside PJM-core, with Virginia alone taking 76. That share barely moves across all twenty of the model's scenarios, holding near 30 percent whether demand grows slowly or fast, and whether siting chases cheap land or proximity to existing hubs.
Steps 1-4: data-center buildings of 100,000 sq ft or more from the DOE/PNNL IM3 atlas, sized by floor space (731 buildings, 168.7 million sq ft). Step 5 switches to modeled projections, which are scenario output rather than announced projects. Both are colored by whether they fall in a PJM-core jurisdiction.
Existing facilities (steps 1-4): IM3 Open Source Data Center Atlas, building layer only (campus polygons enclose their own buildings and would double count). Filtered to buildings of at least 100,000 sq ft within the continental U.S. bounding box: 731 of 1,239 mapped buildings, retaining 168.7M of 191.7M sq ft. Atlas coverage derives partly from OpenStreetMap and is acknowledged by its authors to be incomplete and skewed toward well-documented operators, so it understates the true count. Operator is unrecorded for roughly a third of rows.
Projections (step 5): PNNL CERF-Data Centers model, central scenario only (moderate growth, market gravity 50) — 328 modeled sites, 100 in PJM-core. These are modeled feasible siting locations, not announced, permitted, or confirmed projects; PNNL explicitly warns against using individual locations for local planning, which is why this step stays at national zoom. The source table is a full factorial of 4 growth scenarios by 5 gravity weights, so it must be filtered to one of each; its per-site power field is a constant 36 MW quantization unit and is not used here.
Existing facilities (steps 1-4): IM3 Open Source Data Center Atlas, building layer only (campus polygons enclose their own buildings and would double count). Filtered to buildings of at least 100,000 sq ft within the continental U.S. bounding box: 731 of 1,239 mapped buildings, retaining 168.7M of 191.7M sq ft. Atlas coverage derives partly from OpenStreetMap and is acknowledged by its authors to be incomplete and skewed toward well-documented operators, so it understates the true count. Operator is unrecorded for roughly a third of rows.
Projections (step 5): PNNL CERF-Data Centers model, central scenario only (moderate growth, market gravity 50) — 328 modeled sites, 100 in PJM-core. These are modeled feasible siting locations, not announced, permitted, or confirmed projects; PNNL explicitly warns against using individual locations for local planning, which is why this step stays at national zoom. The source table is a full factorial of 4 growth scenarios by 5 gravity weights, so it must be filtered to one of each; its per-site power field is a constant 36 MW quantization unit and is not used here.
Virginia dominates: 41.8 million square feet across 281 buildings, more than double the next state. Texas, Oregon, and Ohio follow.
About 35 percent of the mapped floor space sits inside PJM-core, which means roughly two-thirds of it sits outside, in states where residential rates barely moved. Plot each state’s data-center floor space against how much its residential prices rose and the pattern holds.
The dots still scatter. The correlation is 0.17, and floor space explains about 3 percent of the variation in price change; ranking the states instead of using raw values barely moves it, to 0.25.
Virginia has more data-center floor space than any other state, 41.8 million square feet, and its residential prices rose 19.9 percent, below the PJM-core average. Maryland has 0.5 million square feet, roughly one percent of Virginia’s, and its prices rose about 40 percent. Iowa is fifth in the nation for floor space and saw the smallest increase in this group, 5.9 percent.
Meanwhile the same 43 states sort cleanly on a different variable. The five PJM-core states here rose 31.0 percent on average; the other 38 rose 15.9 percent.
Being in the grid region predicts your bill. Having the buildings does not.
PJM socializes capacity costs across its whole footprint, so a server hall in Loudoun County raises the capacity bill for a household in Ohio that will never see it.
That also means the buildout doesn’t have to slow down for this to continue. The Pacific Northwest National Laboratory models where new data centers would plausibly go under a range of demand-growth assumptions, and in its central scenario 100 of 328 projected sites, about 30 percent, land in PJM-core states, with Virginia alone taking 76. That share holds steady whether the model sites purely on cheap land or purely on proximity to existing markets. These are modeled locations rather than announced projects, and they should be read as a scenario rather than a plan. But the direction is consistent: the load keeps concentrating in the market that already repriced, which spreads the cost to everyone in it.
Demand growth
Floor space does not predict which states saw the steepest price increases. Electricity demand does track the data-center map, and the gap is large.
Texas electricity demand grew 32 percent from 2012 to 2024. Virginia grew 22.5 percent. Oregon grew 25 percent. Across the rest of the country, demand was flat, up less than 1 percent over the same twelve years. Arizona, Iowa, and Georgia each grew between 14 and 21 percent, all well above the baseline, and all among the top dozen states for data-center floor space.
The divergence sharpened after 2020. Texas went from an index of 116 to 132 in four years; Virginia went from 105 to 123. The rest of the country ended 2024 within a point of where it started in 2012.
So the demand is concentrated where the data centers are. The cost is not. Texas has the fastest demand growth and the second-largest data-center fleet, and its residential prices rose 15 percent since 2022, below the national average. Virginia has the largest fleet and 22 percent demand growth, and its prices rose about 20 percent, well below the 34 percent PJM-core average. The cost tracks the grid market, not the load.
The Texas comparison
Texas built enough new power plants to absorb its data-center demand. Virginia did not, and the difference shows up in the price.
Since 2020, Texas added about 48 gigawatts of new generating capacity: 20 GW of solar, 14 GW of wind, 8 GW of batteries, and 5 GW of gas turbines. Virginia added 4 GW, nearly all solar, on a total fleet one-sixth the size of Texas’s. Relative to their demand growth, Texas outbuilt Virginia roughly ten to one.
ERCOT, the Texas grid operator, runs an energy-only market with no capacity auction. Its annual average day-ahead price peaked at $64 per megawatt-hour in 2022, the same year natural gas spiked, and fell back to $28 by 2024. Through 2025 and 2026 it has averaged about $33 to $34, inside its pre-boom range.
PJM’s capacity auction, by contrast, cleared at $270 per megawatt-day for the delivery year that began in June 2025, and the two auctions after that cleared higher still, at $329 and $333. Same demand driver, different market design, opposite outcome.
Texas lets developers build power plants faster, partly because new projects do not need approval from a regional grid operator. PJM pays generators years in advance to promise availability; Texas pays them only when they actually deliver power. Geography, fuel mix, and regulation all differ. But both regions absorbed a surge of data-center demand, and the one that could build new supply fast enough to match it did not see the same price spike.
Who pays, and who doesn’t
Homes and factories pay different rates for electricity, and the increases did not hit them equally. Measured from 2019 (to avoid the natural-gas spike that makes 2022 a misleading starting point), U.S. residential prices rose about 37 percent while industrial prices rose about 30 percent. The gap is real, but smaller and less universal than those national numbers suggest.
In Texas, households absorbed a double-digit-point premium over industry under every baseline tested. Nationally, households took the larger increase. But the pattern is not universal. In Pennsylvania and Maryland, industrial rates actually rose faster than residential ones over the same period, and in Virginia the two moved together. The clean narrative, that data centers got a break while families paid, does not hold up state by state. And there is a data gap: large facilities increasingly buy power under special contracts that the reported industrial average only approximates, so what those buildings actually pay is partly invisible here.
What’s being built
As of the spring 2026 inventory, U.S. developers had about 122 gigawatts of solar and 63 gigawatts of batteries planned, alongside roughly 67 gigawatts of new natural gas.
Solar and storage still lead the queue by a wide margin, but the notable return is gas. Among projects with a firm expected online date, gas makes up only about 8 percent of what comes online in 2026; by the turn of the decade it is the majority of committed additions. That figure describes what developers have already committed to, not a forecast of the 2030 mix. Solar projects tend to file closer to construction, so the out-years look gas-heavy partly for reporting reasons. Texas, not the PJM states, dominates the build: it has about 94 gigawatts of planned capacity, more than the next four states combined. The place adding the most supply and the places paying the most for capacity are not the same place.
Utility capital spending
Utilities recover capital spending through rates, and the filings they send to federal regulators show a sharp turn upward after 2022.
Utility capital additions sat flat near $96 billion a year from 2019 through 2022, then rose about 50 percent to a record $146.5 billion in 2025. Adjust for inflation and the increase is closer to 36 percent, since construction costs climbed alongside everything else; the real spending in 2025 only modestly exceeds where it stood in 2019. The spending is also broad: distribution, transmission, and generation all rose between 45 and 55 percent from 2022, spanning far more than data-center interconnections. A growing rate base turns into a higher bill.
Energy burden by income
The national residential bill rose from about $1,623 in 2022 to about $1,823 in 2025, roughly $200 more a year. But measured against what households actually earn, the heaviest electricity burdens don’t sit in the states where prices rose fastest.
In Mississippi, Alabama, and West Virginia, the average electric bill eats more than 3 percent of median household income. The driver is not rate increases; it is lower incomes combined with homes running more air conditioning and electric heat. None of the top-10 burden states is a top-10 price-increase state. The households most exposed to the price of power are not the ones absorbing the newest increases.
The natural-gas control
Natural gas sets the marginal price on most of the grid, so it is the first alternative to check. For D.C. and Maryland, gas does not fit the timeline.
Natural gas spiked to $6.42 per million BTU in 2022, then fell to about $2.19 by 2024 — below its 2015-2019 range — even as electricity prices kept rising. Cheap gas cannot explain a 2023-2024 increase. It also cannot explain the shape of the mid-2025 break: D.C.’s residential price stepped up in June 2025 while gas was falling month over month. And it cannot be a story about local gas-fired generation, because the two states with the biggest price jumps barely generate their own power. Maryland gets only about 39 percent of its in-state generation from gas and imports most of what it uses; the District generates almost none of its own electricity at all. Their bills rose because they buy capacity through PJM, not because a gas plant down the road got more expensive to run. Gas did rebound in late 2025, so it is partially consistent with the 2026 increases — but it fits neither the timing nor the geography of the break.
Across the whole country, the share of a state’s generation that comes from gas is uncorrelated with its price change (Pearson r of about 0.11), and the renewable share is no better (0.15).
Cost pass-through and state response
Residential electricity has become one of the fastest-rising costs in the American budget, and data centers are the reason the wholesale market repriced, but the increase does not track the data-center map. It tracks the grid.
In the three years before 2022, the PJM states rose a bit slower than the rest of the country, 11 percent against 13 percent. After 2022, they rose more than twice as fast.
Data centers repriced PJM’s capacity market, and the market’s own monitor attributes 82 percent of the last auction’s increase to them. How much of that lands on any particular household is harder to pin down, because capacity is only one line on a bill that also carries charges for transmission, distribution, and fuel. Much of the infrastructure being built for data-center load gets paid off over decades, not quarters, so the full cost has not arrived yet. Virginia’s own legislative watchdog projects a typical Dominion residential customer paying $14 to $37 more a month by 2040. NRDC projects an average PJM household paying roughly $70 more per month by 2028, and cumulative capacity costs reaching $163 billion through 2033.
There is a second cost channel on top of the capacity charges: transmission. When a generator retires, PJM orders new power lines and substations to keep the grid stable, and the formulas that divide those costs can route a heavy share to the states nearest the retirement. The Maryland Office of People’s Counsel reported in March 2026 that of $22 billion in PJM transmission projects over the preceding three years, Maryland customers were assigned $2 billion. In May 2026, the OPC filed a formal complaint with FERC arguing that Maryland ratepayers face roughly $1.6 billion in added transmission costs driven by data-center demand concentrated in Northern Virginia, with 80 state lawmakers backing the filing. That helps explain why Maryland’s increase outpaces even the PJM-core average: Maryland is absorbing transmission costs allocated to its zones on top of the capacity repricing that everyone on the grid shares.
Not everyone reads the pattern the same way. An EPRI-authored study argues that data centers modestly lowered average U.S. retail rates from 2015 to 2024 via economies of scale, spreading fixed costs over more kilowatt-hours. The authors caution that future supply constraints could reverse the effect, and the study measures averages across the whole country rather than isolating the PJM region where the repricing concentrated.
More than 300 data-center-related bills have been filed across 30 states in 2026. New York enacted the first statewide construction moratorium in July 2026, and at least 12 other states are considering similar legislation. Governor Greg Abbott spent years branding the state the “epicenter of AI development” and courting data-center investment with sales-tax exemptions worth over a billion dollars a year; by August 2026, after constituent backlash over electricity costs and water use, he froze all new grid connections pending audit, called for repealing the incentives, and told reporters the industry had “dug their own grave.”
A household in the District that paid 14 cents a kilowatt-hour in 2022 now pays 24, and the reason is a wholesale market repricing the cost of keeping the lights on for a load growing faster than anyone planned. The receipt goes to everyone on the same grid.
Datasets used:
eia/retail-electricity-prices— EIA retail electricity sales (Forms EIA-826/861/861M): price, sales, revenue, and customers by state and sector, monthly, 2001-01 through 2026-04. Carries the lede, the state ranking, the residential-vs-industrial gap, the burden calculation, and the commercial-sales context.bls/cpi-u— BLS Consumer Price Index for All Urban Consumers: electricity (CUUR0000SEHF01) and all items (CUUR0000SA0), U.S. city average, used for the national inflation frame and to deflate utility capital additions.im3/data-center-atlas— DOE/PNNL IM3 Open Source Data Center Atlas: georeferenced inventory of existing U.S. data-center facilities with operator, county, and building footprint. Carries the floor-space scatter and the Loudoun County figures.pjm/capacity-market-clearing-prices— PJM RPM auction resource clearing prices by delivery year, zone, and product, 2007/08 through 2027/28. Carries the zonal-convergence and RTO-trend charts and the auction figures in the text.im3/projected-data-center-locations— PNNL CERF-Data Centers modeled siting projections through 2035 across 20 growth and market-gravity scenarios. Used only for the share of projected sites landing in PJM-core states.bls/qcew-data-centers— BLS Quarterly Census of Employment and Wages, NAICS 518210, private sector, state and county aggregation, 2014-2025. Used for the Loudoun County employment figures.pudl/ferc1-plant-in-service— PUDL’s parse of FERC Form 1 electric plant in service: additions, retirements, and balances by utility and account, 1994-2025. Used for the capital-spending trail and its decomposition by plant function.eia/generator-inventory— EIA-860M monthly generator inventory, May 2026 vintage: operating and planned units by technology, capacity, and expected online year. Used for the buildout charts.eia/natural-gas— Henry Hub monthly spot price, 1997-2025, used as the natural-gas confounder control.eia/state-generation-mix— EIA electric-power operational data: net generation by state and fuel, monthly, 2001-present. Used to check that the lede states’ price increases are not explained by in-state gas dependence.census/median-household-income— Census ACS median household income by state, used for the energy-burden calculation.eia/eia-861-sales— EIA Form 861 annual retail electricity sales by utility, state, sector, and service type, 2012-2024. Used for the demand-growth index chart (bundled service type, Part A only, to avoid the deregulated-state double-count).eia/generator-inventory-annual— EIA Form 860 annual generator inventory, six vintages (2014-2024 in even years), generator-level with technology, capacity, state, and online year. Used for the Texas-vs-Virginia supply-response comparison.ercot/dam-settlement-point-prices— ERCOT day-ahead market settlement point prices, hourly, 2010-2026. Used for the ERCOT annual wholesale price trend (HB_BUSAVG bus average).
Methodology:
Unless noted, “since 2022” compares the CY2022 monthly average against the trailing 12 months, 2025-05 through 2026-04, the latest full year of data. Where a 2022 baseline is a rhetorical risk — 2022 was the peak year for natural-gas prices — the analysis re-runs from CY2019 and CY2021 baselines; the residential-vs-industrial gap is reported from the 2019 baseline for that reason, and the PJM-core split is shown with a 2019-to-2022 placebo period. “PJM-core” denotes the eight jurisdictions where PJM serves all or nearly all retail load (D.C., Maryland, New Jersey, Delaware, Pennsylvania, Ohio, Virginia, West Virginia); partial-PJM states such as Illinois, Indiana, Kentucky, Michigan, North Carolina, and Tennessee fall in “the rest,” which biases the comparison against the split rather than toward it. The floor-space scatter uses the IM3 atlas building layer, summed by state, against residential price change since 2022, across the 43 states present in both sources; the Pearson correlation is 0.174 on raw floor space, 0.239 on log floor space, and 0.252 on ranks, for an r-squared of 0.030. The atlas ships three overlapping layers (point, building, campus) and a campus polygon encloses its own buildings, so the analysis filters to the building layer alone; summing building and campus together double-counts and wrongly promotes Ohio over Virginia as the top state. Atlas coverage derives partly from OpenStreetMap and is acknowledged by its authors to be incomplete and skewed toward well-documented operators, so it understates total floor space by an unknown amount and is treated as the best available inventory rather than a census. An earlier version of this analysis used BLS QCEW NAICS 518210 employment growth as the presence measure and found a correlation of 0.03; that measure was replaced because employment is a poor stand-in for electrical load, and the substantive conclusion did not change. The projected-siting figure filters to a single growth scenario and market-gravity weight, since the source is a full factorial of 20 alternative futures and an unfiltered sum counts the same capacity 20 times; its per-site IT power field (data_center_it_power_mw) is a constant 36 megawatts, a quantization unit rather than a per-facility power estimate, and is therefore not used as a load measure anywhere in this article. Utility capital additions use the exact electric_plant_in_service total label (a common query trap double-counts a roll-in account and roughly doubles the figure); the real series deflates nominal additions to 2025 dollars using CPI-U all items, which understates construction inflation and therefore overstates the real increase, if anything. The energy-burden figure divides an average annual residential bill (summed monthly revenue over average customers) by median household income, mixing a mean against a median; it is labeled accordingly. Maryland’s provisional March 2026 price (35.85 cents per kWh, an EIA-861M value surrounded by months near 20-22 cents) is omitted from the lede chart and excluded from Maryland’s trailing-12-month average, which lowers Maryland’s measured increase from 49 percent to about 41 percent; the figure is reported as a range in the text where it matters.
Claims sourced outside the datasets. PJM’s estimate that the Critical Issue Fast Path rule changes accounted for less than 20 percent of the decline in excess capacity between the 2024/25 and 2025/26 auctions comes from PJM’s October 2024 response to the IMM’s auction report, linked inline. The Maryland OPC’s $22 billion and $2 billion transmission-allocation figures, the $1.6 billion projection of data-center-driven transmission costs, and the 80-lawmaker backing come from the OPC’s March 2026 report and its May 2026 FERC complaint (Docket EL26-63), linked inline.
The capacity clearing prices themselves — $28.92 for 2024/25, $269.92 for 2025/26, $329.17 and $333.44 for the two following years, the $466.35 Baltimore cap, the $444.26 Dominion price, and the $426.17 DPL South price — are queried directly from pjm/capacity-market-clearing-prices and are not external claims. The dollar totals that the auction produced ($14.7 billion, up from $2.2 billion) and the attribution of $7.3 billion, or 82 percent, of the most recent increase to data-center load come from PJM’s Independent Market Monitor and contemporaneous reporting, linked inline; the clearing-price dataset carries prices, not revenue totals or their decomposition. The market monitor’s characterization of data centers as the primary reason for current capacity-market conditions, and the roughly 5,400-megawatt jump in PJM’s peak-load forecast, likewise come from the monitor and PJM’s own release. The Maryland standard-offer-service rate increases effective June 1, 2025, and the projection of household increases as steep as 24 percent, come from the Maryland Office of People’s Counsel and Maryland Public Service Commission, linked inline. The $14-to-$37-per-month 2040 projection for Dominion residential customers comes from the Virginia Joint Legislative Audit and Review Commission’s December 2024 study of data centers in Virginia.
The demand-growth chart uses EIA-861 annual retail sales, Part A, bundled service type only. In deregulated states (Texas, Ohio, New Jersey, parts of Virginia and Pennsylvania), customers are split between “Bundled,” “Energy,” and “Delivery” service types, and summing all three double-counts sales volume. Filtering to bundled understates demand in restructured states, which biases the Texas and Virginia indexes downward and the divergence against the finding. “Rest of U.S.” excludes the three named series (Texas, Virginia, Oregon) and includes all other states. The supply-response chart uses the EIA-860 annual generator inventory (2024 filing), operating units only, filtered to the five listed technologies; the gas figure for Texas combines combined-cycle (1,244 MW) and combustion-turbine (3,777 MW) additions. Excludes distributed solar, rooftop systems, and plants under 1 MW. ERCOT wholesale prices are the annual average of hourly day-ahead market settlement point prices at HB_BUSAVG (the system bus average); 2026 is year-to-date through September.
On the numbers being conservative. Widely circulated figures put Maryland’s increase near 74 percent and the District’s near 94 percent. Those measure from a March 2021 baseline to a March 2026 spot price. This article measures from a CY2022 annual average to a trailing-twelve-month average, and additionally excludes Maryland’s provisional March 2026 print. Both choices damp the result, so the increases reported here sit at the conservative end of the published range by construction, not by disagreement with those sources.
On causation. This article makes two claims of different strengths and tries not to blur them. The first, that data centers drove PJM’s capacity repricing, rests on the market operator’s own monitor stating it directly and quantifying it; that is an attribution by the institution with the best view of the market, not a correlation found here. The second, that the resulting cost lands by grid region rather than by proximity to a facility, is observational: the geographic pattern survives a natural-gas control, a placebo window, and a switch from an employment proxy to a physical floor-space measure, but it remains a pattern in state-level averages. The weak floor-space correlation is evidence about where costs land, not evidence that data centers are blameless, and the article is careful never to use it that way. The pass-through from a capacity auction to any individual household bill is the genuinely open question, and it is left open.